Downstream
What uncontrolled irrigation looks like (and what controlled irrigation looks like)
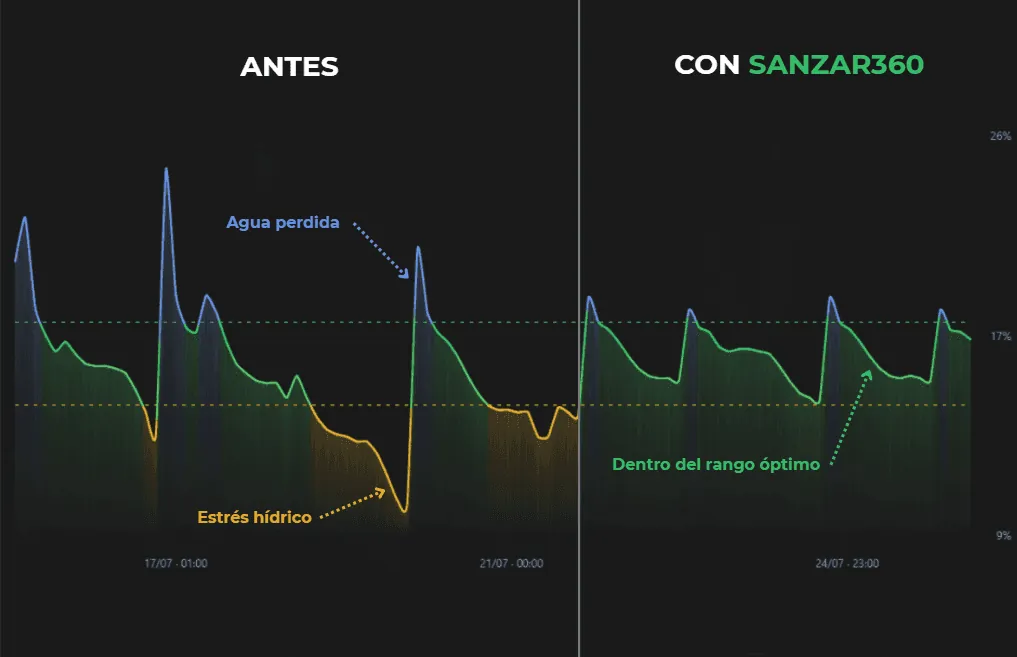
Almost every farmer has heard that you need to “irrigate sensibly”. It is rarely shown what that means on a real chart. So here it is: the same plot, the same soil moisture, measured over several days, before and after using data instead of habit.
What lies behind a threshold
Every soil has two limits that define its useful water range. At the top, Field Capacity: the point at which the soil cannot hold any more water, and anything applied beyond it simply drains downwards, out of reach of the roots. At the bottom, the Permanent Wilting Point: the point at which the roots no longer have the strength to draw out the remaining water, and the plant enters a stress it does not recover from even if it is irrigated afterwards.
Between those two points is the water actually available to the crop. The thresholds that Sanzar360 sets are not an arbitrary number: they are an estimate of that range, adjusted to the real texture of each plot (a sandy soil is not the same as a clay soil), and they are refined by comparing how the soil actually responds to each irrigation.
What irrigation without that criterion looks like
On a plot irrigated by calendar or by intuition, the moisture chart has a recognisable shape: peaks that shoot well above the upper threshold (water that has just been thrown away and that the plant will never use), followed by drops that, a few days later, cross the lower threshold (the crop going thirsty before the next irrigation arrives, too late). The pattern repeats, irregularly, every time someone decides to irrigate “because it is time” or “just in case”.
What changes with data
With Sanzar360, the same plot shows a different curve: irrigation comes when the sensor shows that moisture is approaching the lower limit, not before or after, and stops before going far beyond the upper limit. The curve keeps moving, because the crop uses water every day, but it moves within a controlled range, without the extremes that waste water or put the harvest at risk.
The chart does not lie
This is not a marketing promise: it is literally what you see when you overlay the moisture data from before and after. Two concrete, measurable advantages: less water used in total, and a crop that never crosses the point of no return of water stress.
Contact us to see what this same chart would look like on your own plot.